Blog
Prognozowanie
Forecasting seasonality with a hammer
It seems like it will be my first article in English. Why in English? Reason for it is as follow - it is the third time that I encounter astonishing situation which is: moving average does not work, use specialized (and costly) software to solve Your (in my opinion simple) forecasting problem. Forecasting package MAYBE useful, but basic forecasting skill is NECESSARY. Do not start with software implementation if your team does not understand foundation!
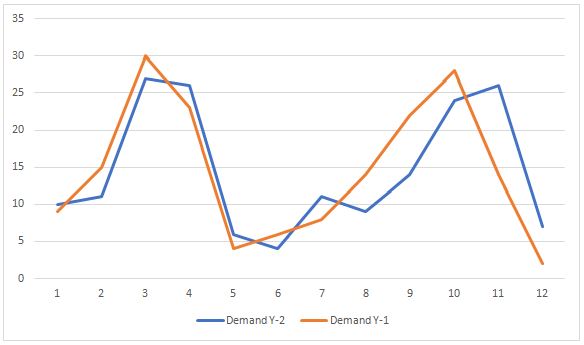
This is the demand pattern. There are two peaks in month 3 and 4 and in 10 and 11 when we consider Y-2. There is some similarity in Y-1, but… As for month 3 and 4 it looks almost the same. Small variation in month 4. Variation at the second half of the year is bigger. It looks like second seasonal peak starts earlier. There are higher sales in month 8, 9 and 10. Unfortunately the season ended earlier, too. Sales in month 11 is very low. It is all obvious, isn’t it?
For the sake of simplicity (for the moment), we assume there is no promotions, it is simply seasonality.
So, let us forecast! Really? It seems like we in Poland we want one step more before forecasting – write down the assumptions for the forecast. What? Yes! Before you start to forecast learn about your demand. Figure out demand characteristics and write them down. Those will be your forecast assumptions.
Let assume that above demand pattern is for… umbrella. Why the demand looks like that? Hm… let us think. What do we use umbrella for? It protects us from rain. But in winter (months 1, 2 and 11, 12; temperature is below zero) it is usually snowing in Poland. Of course, some people use umbrella but not so many. When temperature is above 0 Celsius degrees it still rains but together with wind it makes worse conditions outside. That is the cause for first peak. There are more rains fall during summertime, but temperature is around 25, up to 35 Celsius degrees, so this is warm rain – refreshing. Next the autumn is coming – it is getting colder and rain is falling. This is the cause for another peak in umbrella sales.
To summarize: we have seasonality – our first demand characteristic. It is also our first assumption means that if there was seasonality in previous years, we assume to have seasonality next year too.
As for trend – there is not any. Total volume for both years is the same – it is 175 (in thousands of pieces). Do we have any information from sales, marketing about trend? If not, it is quite safe to assume that the volume will be similar.
There is of course some variation. We can see it from the graph.
Can we count for anything else? What about cyclicity? We have only two years of historical sales – it is not enough to see cyclicity.
We have all – we can do the forecasting. We should choose the technique. And this is the point of this article: we already encounter 3 times that for seasonal demand people choose “some kind of” moving average! This technique completely does not fit seasonal demand. It is obvious! Nevertheless, people are using it! Furthermore, this is the reason to claim that average does not work!
When we put into place 2-period moving average the graph will look like that:
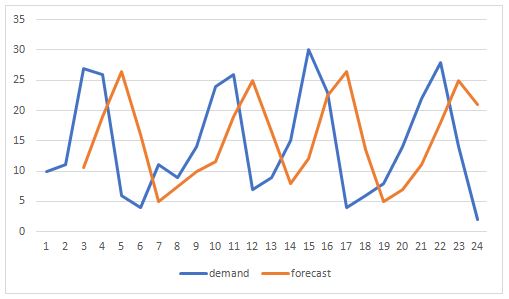
It is pretty good, but we are always late. When we take 5-period moving average level change the graph will look like that:
I “love” this forecast for period 10 and 21-22. When the forecast says sales will go down, boom! We have increase in sales. As for 10-period:
The difference between 5-period and 10-period is not a big deal. But this is only graph. Let us check some measurement for forecast – weighted MAPE in this ex-post exercise:
2-period: 70%
5-period: 62%
10-period: 60%
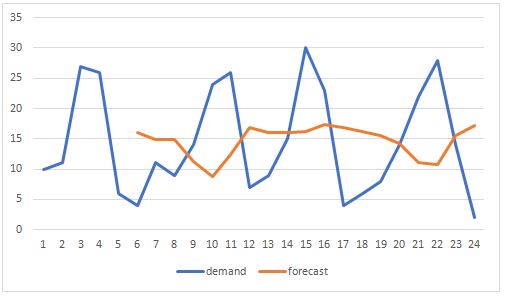
For the previous forecast we had to use some formula. Very often the output of such forecasting looks like that (it is the simple average from the whole previous year and then this is a forecast for next year):
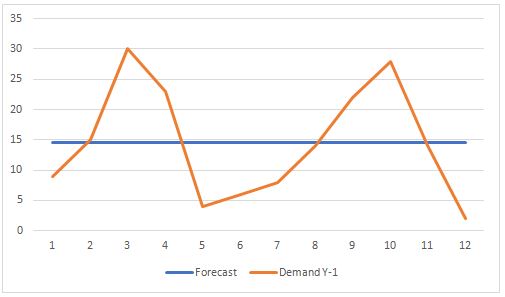
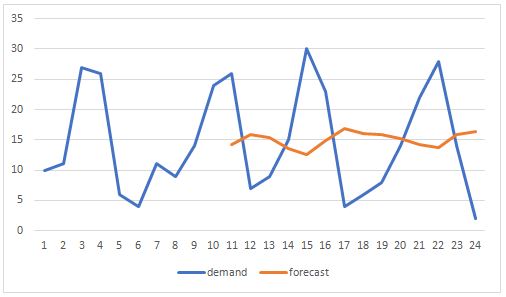
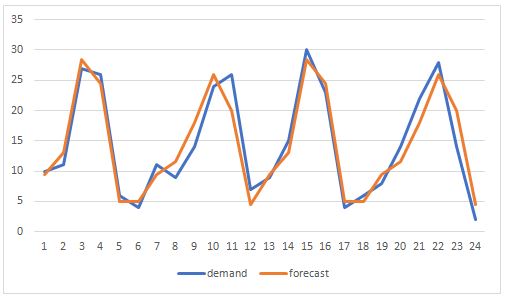
In that case WMAPE is… 52%. What an improvement! I just wonder why not use simple seasonal indices or sales ratios? Example below is just seasonal indices with WMAPE equals 15%.
For us it not a rocket science, but it seems we are wrong! What do you think? Why many people do not connect those points:
- seasonality connects with seasonal indices or sales ratio?
- seasonality does not match to averages?
Konrad Grondek
Examples:
https://blogs.sas.com/content/sascom/2015/05/26/stop-cleansing-your-historical-shipment-data/
together with discussion on Demand Management & Forecasting group on LI